Key Takeaways
✅ Interactive and Intuitive Visualizations: Imagine you’re looking at a sea of numbers—quite overwhelming, right? Good news! The cream of the crop in data visualization tools is here to transform that numeric ocean into interactive, intuitive visuals, making complex data a piece of cake to understand.
✅ Customization and Integration: Picture your business as a unique puzzle; each piece represents a chunk of data. These stellar tools aren’t just a one-size-fits-all—they’re like a Swiss Army knife, tailored to fit your data needs and effortlessly integrate with your existing resources.
✅ Collaboration and Sharing: Ever played a game of telephone and ended up with a muddled message? That’s history. With these tools in your arsenal, you can collaborate with your team in real-time, share insights like a pro, and make sure everyone’s singing from the same data hymn sheet.

Introduction
Have you ever wondered how some businesses seem to magically transform raw numbers into a gold mine of insights? Well, what if I told you that it’s not magic, but the power of top-notch data visualization tools working behind the scenes? That’s right; in today’s business scene, the ability to effectively interpret data isn’t just nice to have—it’s absolutely critical for smart decision-making.
Whether you wear the hat of a savvy marketer, a financial maestro, or an operations whiz, the tools we’re about to dive into hold the key to turning data noise into a symphony of insights. They’re not only cutting-edge but also user-friendly—built to provide you with a panoramic view of your business landscape.
By blending innovative perspectives with modern trends, these tools can be your allies in maximizing revenue, ROAS, and ROI, propelling you towards business excellence. So let’s tease those neurons and entice you with the promise of actionable insights and groundbreaking information that could very well redefine the way you view your piles of data. Ready to unearth some business-transforming treasures? Let’s get to it!
Top Statistics
| Statistic | Insight |
|---|---|
| Global Market Size: Valued at $6.53 billion in 2020 with a CAGR of 9.4% from 2021 to 2028. (Source: Grand View Research) | This growth shows a strong, increasing need for companies to make sense of their data – a real call to action for businesses to adopt these tools. |
| Cloud-based Adoption: Expected to drive market growth by 10.7% CAGR from 2021 to 2028. (Source: Grand View Research) | The move to the cloud reflects the flexibility and scalability that businesses crave. Miss out, and you might fall behind. |
| User Demographics: Dominated by IT and telecom, BFSI, healthcare, retail, and manufacturing industries. (Source: MarketsandMarkets) | It seems like nearly every field is diving into data! Have you ever wondered how data visualization could change your industry? |
| North American Market Share: Accounted for 39.2% of the global market in 2020. (Source: Grand View Research) | North America is taking the lead here. How can other regions leverage these tools to catch up or carve out their own niche? |
| Tableau’s Market Share: Accounted for 26.9% of the global market in 2020. (Source: Grand View Research) | Tableau’s significant slice of the market pie tells us it’s a heavyweight champion. Is there a reason it’s the crowd favorite? |

Understanding Data Visualization Tools
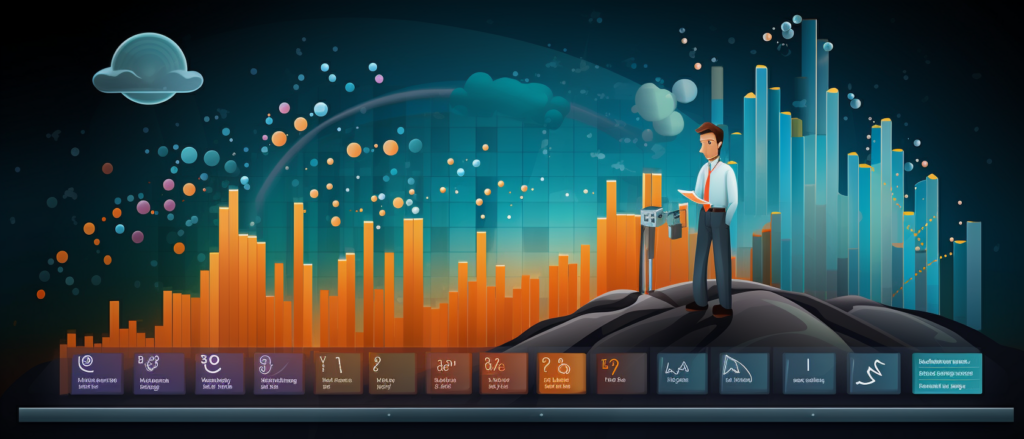
Ever stopped at a busy crosswalk and noticed how everyone just knows when to walk or stop based on the changing lights? Data visualization is a bit like that for businesses. It transforms numbers and data into visual graphs and charts, making it simpler for folks to understand and react to information quickly. Visualization tools are the gadgets and software that turn complex data into those clear, eye-catching visuals—think of them like the traffic lights for your company’s data.
These tools come in many shapes and sizes. Some are made for the pros, with all the bells and whistles, while others are more like a friendly guide for those just getting their feet wet in data stories. The common thread? They help teams make sense of data quickly to make better, informed decisions. Think about it: you wouldn’t want to sift through endless spreadsheets to figure out your next big business move, right?
Top Data Visualization Tools
Now, let’s chat about some of the top dogs in the data visualization world. Starting with Tableau, this tool is like a Swiss Army knife for data because of its interactive visualizations and nifty data exploration chops. It’s great for diving deep into your data and coming up with insights that would otherwise be tough to spot. Then there’s Power BI, which plays really well with other Microsoft products—if you’re already using them, it’s a bit like finding a puzzle piece that fits just right. It’s packed with advanced analytics that can help predict trends and keep you ahead of the game.
What about QlikView? It’s all about making connections with its associative data indexing, which is a fancy way of saying it makes finding relationships in your data a piece of cake. Real-time analytics can give you the power to make decisions on the fly, adapting as things change. And don’t forget about Tableau Public. It’s the generous cousin of Tableau that lets you share your data stories with the world for free. Perfect if you’re working on projects that you want to shout about from the rooftops.

Choosing the Right Data Visualization Tool
Picking out the perfect tool can feel like trying to find the best ice cream flavor—overwhelming because they all look good. But, factors to consider include your budget, the kinds of data you’re dealing with, who’s going to use the tool, and whether it can grow with your business. Compare the big names out there on things like features, ease of use, and yes, the damage to your wallet. A word to the wise: don’t just go for the shiniest gadget on the shelf. Think about what works for your team and your goals.
Best Practices for Effective Data Visualization
Creating visuals that stick isn’t just about making them look pretty. Clear and compelling visualizations are about getting your message across without making your audience scratch their heads. Choose the right type of chart for your data and add design elements that enhance the story, not distract from it. Remember, it’s about telling a story with your data. So, like a good book, make sure that story is one people will want to follow.
Case Studies and Real-World Applications
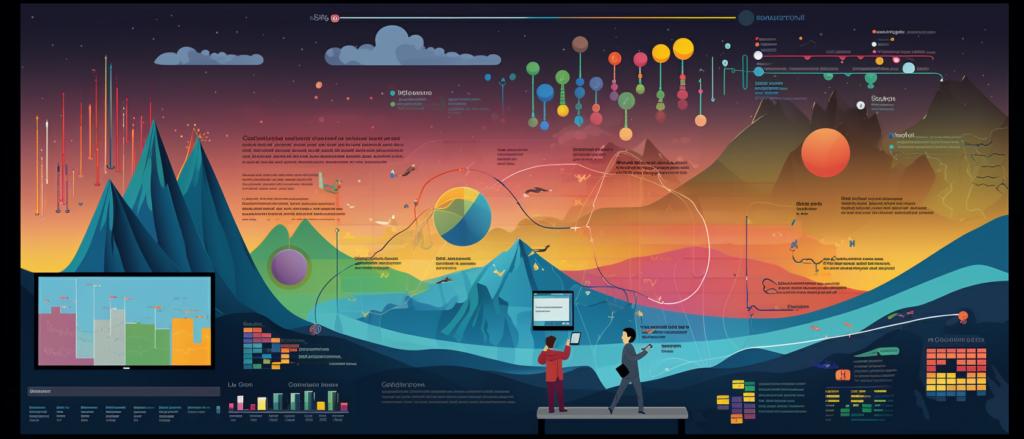
Let’s talk real talk—examples of how this stuff makes a difference. There have been companies in retail, healthcare, and even sports that have leveraged data visualization to make huge gains. From boosting sales by spotting market trends to helping hospitals manage their resources better, these tools have had some impressive impacts. Stories like these showcase how turning rows and columns into vivid charts can drive business performance and sharpen up decision-making.
By now, it’s pretty clear, isn’t it? Data visualization tools are no mere fads; they’re like the trusty sidekicks helping businesses navigate through information jungles. They turn the complex into digestible stories and insights, which can be the golden ticket to not just surviving but thriving in today’s data-driven market. So, why not see how they can fit into your story? Ready to start exploring?
AI Marketing Engineers Recommendation
Recommendation 1: Leverage Storytelling in Your Visuals for Enhanced Engagement: Let’s be real, nobody wants to stare at boring charts that look like they came out of a dusty old textbook. Instead, transform your data into a narrative. You know what’s catchy? A good story. When you pick a Top Data Visualization Tool, make sure it allows you to weave a story around your data. Aim for a tool that’s user-friendly and supports dynamic and interactive visualizations. By doing that, you turn numbers into a tale of your business’s journey, making it easier for your team to spot trends, make informed decisions, and engage your audience. After all, when was the last time a pile of spreadsheets made you feel something? Use visuals that can!
Recommendation 2: Integrate Real-Time Data For Swift Decision-Making: In today’s fast-paced world, yesterday’s news is practically ancient history. You need tools that give you the now—because decisions wait for no one. Find a Top Data Visualization Tool that pulls in real-time data so your business can react at the speed of life. Imagine knowing customer trends as they happen or catching a market change the second it shifts. With real-time data, you’re driving with your eyes wide open, seizing opportunities before they pass you by. Isn’t that a superpower you want on your side?
Recommendation 3: Employ Interactive Dashboards to Empower All Team Members: What if every person in your team, regardless of their tech skills, could dive into data like a pro? Choose a Top Data Visualization Tool that offers interactive dashboards. Such a tool cuts through complexity, allowing team members to customize their view and interact with the data directly. This way, not only do you democratize data access in your team, but you also encourage a culture of data curiosity and self-service analytics. Imagine a world where insights are at everyone’s fingertips—now that’s how you breed innovation. Isn’t it time everyone got to play with the numbers?

Relevant Links
Maximize Your Market Impact with Astonishing Data Visualization
– Unlocking the Power of Data: The Art and Science of Data Visualization
– Data Visualization Tools: Your Business Intelligence Beacon
– The Influential Role of AI in Enhancing Data Analytics
– Types of Data Visualization: A Guide to Transforming Business Intelligence
SEO and Content Creation Strategies Powered by AI
– Maximize SEO Marketing Efficacy: Strategies and Best Practices
– Embracing ChatGPT for Ingenious Marketing Content
– Gain the SEO Edge: Advanced Marketing Strategies for 2024
– Leveraging AI to Unleash Your Brand’s Storytelling Potential
Revolutionizing Business Growth with AI
– AI Tools: Revolutionizing Business Strategy and Innovation
– Success-Driven AI Marketing: Turning Insights into Revenue
– AI Analytics: Magnifying Marketing Insight Accuracy and Efficacy
– Infusing AI Enhancements into E-Commerce Marketing
Career Advancements and Strategies in Marketing and Analytics
– SEO Marketing Mastery: Journey Through Top-Rated Courses
– Fundamentals of Data Analytics: Boost Your Marketing Career
– Advanced Techniques for Cutting-Edge Marketing Analytics
– Solidifying Your Business Statistics Skills for Succeeding in Marketing
Emerging Marketing Trends and Tech for Strategic Growth
– Digital Campaign Innovation: Anticipate the Evolution in Marketing
– Top Digital Marketing Trends for 2024: Staying Ahead of the Curve
– Strategizing Marketing with Generative AI: Bridging Creativity and Analysis
– Innovative Marketing Techniques: Nurturing Digital Interaction and Engagement

Conclusion
Let’s recap the adventure we’ve been on, shall we? We’ve witnessed the transformation power of data visualization tools. They’re not just fancy charts and graphs; they’re your ticket to understanding the story behind rows upon rows of data. Informed decision-making—that’s why all this matters. It’s about making sense of the numbers, patterns, and trends that could shape the future of your business.
Think of Tableau’s interactive canvases or Power BI’s seamless connection with other Microsoft tools. Remember how QlikView lets you dive right into live, crunchable data? Or how Tableau Public offers a snapshot of visualization for everyone to see and learn from? We’ve explored all these tools not just to learn their names, but to understand the strengths they could bring to our tables.
Choosing the right tool is like picking the right companion for your journey—each has its own set of skills and quirks. Ask yourself, will it fit the budget? Can it grow with you? Will it play nicely with the data you feed it? We didn’t just list the options; we gave you a compass to find your way.
Before you head back into the world, loaded with this newfound knowledge, I leave you with a question: How will your business’s story unfold with the right data visualization tool in your arsenal? The tools we’ve talked about are more than just software—they are the lenses through which your data can tell its most impactful stories.
FAQs
Question 1: What are data visualization tools, and why are they important for business insights?
Answer: Data visualization tools are like the supercharged paintbrushes for your data. They take all those numbers and figures and turn them into pictures like charts and maps that tell a story. This matters because it lets businesses see the bigger picture, catch onto what’s trending, and make smart moves without drowning in spreadsheets.
Question 2: What are the top data visualization tools available in the market today?
Answer: On the top of the leaderboard, we’ve got hot names like Tableau, Power BI, and QlikView lighting up the scoreboard. Looker and Google Data Studio are also making waves, and for the code wizards, there’s matplotlib if Python is your kind of magic spell.
Question 3: How do I choose the right data visualization tool for my business?
Answer: It’s like picking the right ingredients for your secret sauce. Think about your budget, how complex your recipes (data) are, whether you need a sous-chef level of expertise, if it needs to play nice with other kitchen gadgets, and what kind of flavor (features) you want to taste in the end.
Question 4: What are the key features to look for in a data visualization tool?
Answer: Keep your eyes peeled for tools that are easy to use, let you customize to your heart’s content, update with the speed of a street racer, let your team huddle around, work on your phone, and can gobble up hefty datasets without breaking a sweat.
Question 5: How can data visualization tools help in data storytelling?
Answer: They’re the stage directors for your data’s debut play. They help you spotlight the main actors (key insights), paint the scenery, and make sure the audience (stakeholders) stays awake, understands the plot, and maybe even gives a standing ovation.
Question 6: What are some best practices for creating effective data visualizations?
Answer: You’ll want to avoid a visual circus. So, pick the right kind of chart that tells your story best, keep the design clean and tidy, stick to colors that make sense together, and make sure everyone in the crowd can enjoy the show, whether they’re in the front row or the balcony.
Question 7: How can data visualization tools help in identifying trends and patterns in data?
Answer: They’re like that friend who can spot a pattern from a mile away. With fancy charts like heatmaps and scatter plots, you can see how things are connected, where they’re heading, and you might even solve the mystery before the detective does.
Question 8: Can data visualization tools be used for predictive analytics?
Answer: Absolutely. Some of the sharper tools in the shed, like Tableau and Power BI, can grab their crystal balls and help you tell fortunes, or, you know, predict market trends and make plans that could save the day down the road.
Question 9: How can data visualization tools be integrated with other business tools and systems?
Answer: These tools are team players. They can shake hands with your CRM, ERP, and data warehouses, which means your data won’t be trapped in different silos, and you get to see the whole, interconnected picture.
Question 10: What are some resources for learning more about data visualization and its best practices?
Answer: The learning buffet is open! Dive into online courses, snack on some books, scroll through blogs, or attend industry meet-ups. And don’t forget about the community potlucks—forums and online groups where you can trade recipes (ideas) with others.
Academic References
- Friendly, M. (2008). The history of data visualization: An interdisciplinary approach. Bulletin of the American Meteorological Society, 89(6), 883-897. In this article, Michael Friendly takes us on a captivating journey through time, exploring the rich tapestry of data visualization. He draws connections across various fields like statistics, cartography, and computer science, to reveal how they’ve collectively shaped our modern tools. It’s a fascinating read that underscores the importance of understanding the past to truly grasp the significance and future potential of data visualization in our lives.
- Few, S. (2006). Data Visualization: A Successful Design Process. Analytics Press. Can a well-crafted chart change the way we see business data? Stephen Few believes so. His book presents a diligent process for constructing data visualizations that not only look good but communicate effectively. This is a must-read if you aim to turn complex data into clear, intuitive insights that drive business decisions.
- Wilkinson, L. (2005). The Grammar of Graphics (2nd ed.). Springer. Leland Wilkinson introduces a language in ‘The Grammar of Graphics’ that transforms how we discuss and create data visualizations. It’s about establishing a common ground—a sort of grammar—that allows analysts, designers, and users to speak the same visual language. Dive into this book to fortify your foundation and better collaborate in the world of data visual storytelling.
- Wilke, C. O. (2019). Data Visualization: Principles and Practice (2nd ed.). CRC Press. Imagine if you could peek into the blueprint of compelling data visuals. Claus Wilke offers just that—a deep dive into the core principles that make data visualization tick. This resource is your companion for understanding the ‘why’ and ‘how’ behind the visuals, helping you not just to design but to comprehend the underlying mechanics at play in the business data you encounter daily.
- Keim, D., Aigner, W., & Ester, M. (2010). Data Visualization for Business Intelligence. Morgan Kaufmann. Daniel Keim and his co-authors don’t just discuss data visualization; they highlight its pivotal role in business intelligence. It’s all about turning overwhelming data into actionable insights. For anyone on the frontline of data-driven decision-making, or if you’re just trying to get a grip on complex business processes, this book shines a light on how visual tools can lead to clarity and confident decision-making.