Key Takeaways
✅ Identify Friction Points and Drop-Offs: Discover where your customers are getting stuck and leaving, and learn how to smooth out these rough spots to keep them moving towards a purchase.
✅ Track Conversion Rates and Time to Conversion: Uncover the effectiveness of your sales tactics and the speed of your customer journey, and find out how to make both metrics soar.
✅ Use Funnel Metrics to Improve Forecasting and Strategy: Leverage precise data to predict future sales and make informed decisions that will direct your business towards success.
Introduction
Are you in full control of your sales process, or are you leaving money on the table? Analyzing Your Sales Funnel using Performance Metrics can be the game-changer in your quest for Enhanced Funnel Efficiency. Knowing where each potential buyer is on their journey, and how effectively they move to the next stage, is like having a road map to your business's success.
This article isn't only about the what and the why; it's about giving you the how. We'll dive into modern strategies and tools that can fine-tune your marketing machine, turning those just-looking visitors into loyal customers, all while boosting your return on investment (ROI). Get ready for actionable insights that will not only enlighten but can also be put into practice right away to see tangible results. Keep reading to unlock a treasure trove of insider knowledge that could redefine your business's pathway to prosperity.
Understanding the Importance of Sales Funnel Metrics
When we talk about figuring out how well we're doing in grabbing the attention and wallets of our potential customers, sales funnel metrics are our best friends. These metrics are more than just numbers—they tell us a story about what’s working and what’s not in our journey to convert people from casually browsing to actually buying. What are we missing? Where are we spending too much money, and where could we possibly double down to get better results? By diving into these metrics, a company can pinpoint exactly where they need to beef up their game to improve the whole process of bringing in new customers.

Defining the Sales Funnel
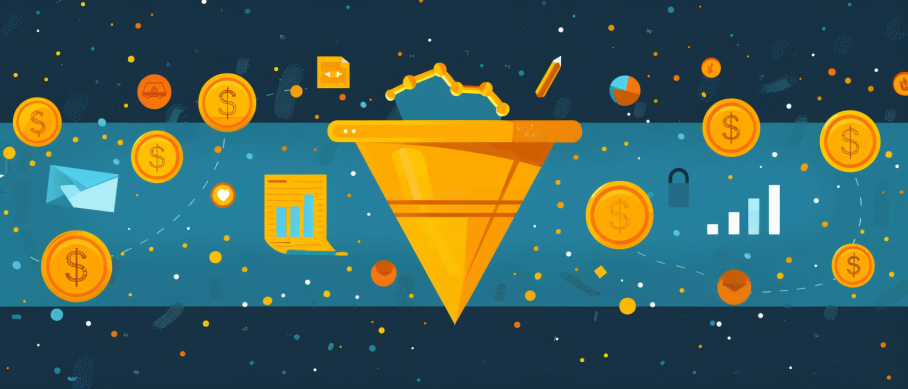
The sales funnel is essentially the map that potential buyers follow from the minute they learn about a product or service to the moment they make a purchase—or decide not to. Think of it like a guide that leads someone from “just looking” to “take my money!” The journey starts wide with many potential customers at the awareness stage and then narrows down, ideally leaving only those who are ready to part with their cash at the action stage.
Key Performance Indicators (KPIs) for Sales Funnel Analysis
Let's talk about the crucial signs of health for your sales funnel—the vital signs for your sales patient, if you will. Conversion Rate is at the heart of it all, showcasing the percentage of those who go through with a purchase. But we can't ignore how much we're spending to get people into our funnel in the first place—that’s where Lead Acquisition Cost and Customer Acquisition Cost come into play. And then, there’s the important question of what a customer is worth over time, aptly named Customer Lifetime Value (LTV). Finally, remember that time is money, so keeping an eye on the Cycle Time can tell us just how quickly we're moving customers from “hello” to “here’s my credit card.”
Benefits of Sales Funnel Analysis
Digging into these metrics helps to spot the bottlenecks. Where do potential buyers get stuck? At which point do they walk away? This isn't just about counting numbers—it's about shaping the future. By getting this insight, businesses can make stellar predictions about their sales, encourage teamwork to make the process smoother, and make smart decisions based on hard data, not just gut feelings.
Visualizing the Sales Funnel
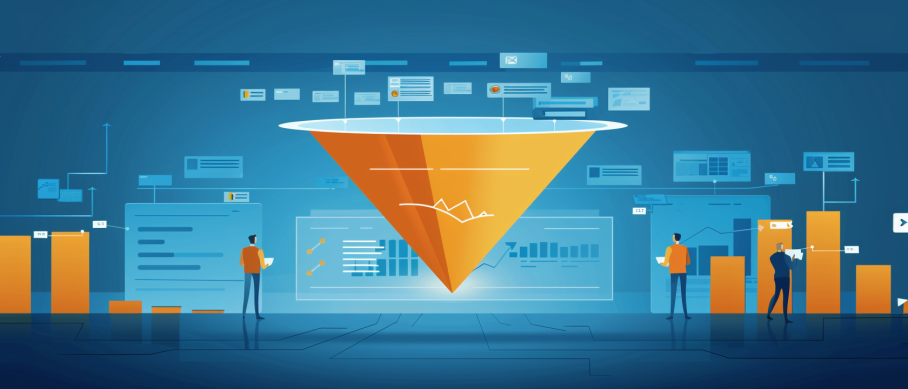
Visual tools make understanding the sales funnel a walk in the park. Picture this: graphs and charts clearly laying out each step of the customer journey, with colors and shapes highlighting where people are jumping ship or cruising smoothly through. You can see at a glance where things are snagging up. Funnel Visualization and bar charts help to quickly identify where customers are getting lost. Meanwhile, Cohort Analysis takes us into a deeper dive, unraveling the motivations and behaviors of different groups, helping us tailor our pitch to fit their unique needs and wants.
Implementing Sales Funnel Analysis
Now, to put this all into practice, you'll need the right tools—think of them as the workhorses that do the heavy lifting of data crunching. Tools like Amplitude come in handy to make sense of all the chaos. Set your own gold standard with benchmarks that reflect your company's goals, and then keep a close watch like a hawk. Sales funnel analysis isn't a one-time deal; it's an ongoing mission to fine-tune and perfect the journey you're taking your customers on, making sure each step is leading them closer to that 'purchase' button.
AI Marketing Engineers Recommendation
Recommendation 1: Prioritize Conversion Rate Optimization (CRO) at Each Funnel Stage: Harness the power of CRO by diving into the data on where prospects drop off. Track conversion rates from awareness to consideration and through to decision making. Did you know, according to WordStream, the average landing page conversion rates hover around 2.35%, yet the top 25% are converting at 5.31% or higher? Strive to be in that top tier by continually testing and tweaking page elements such as call-to-action (CTA) buttons, headlines, and form designs to boost those percentages. Maximizing conversions at each stage primes the funnel for increased efficiency and drives more qualified leads towards purchase.
Recommendation 2: Lean on Predictive Analytics for Forecasting and Personalization: In today's digital age, using historical data to predict future trends is no longer a novel concept; it's a necessity. Gartner predicts that by 2023, organizations using predictive analytics will outperform competitors in terms of profitability by 20%. With this in mind, use predictive models to anticipate customer behaviors and tailor the sales journey accordingly. This can include personalizing communications, scoring leads to focus on those most likely to convert, and managing inventory to meet forecasted demand. Staying ahead with predictive analytics positions your strategy on the cutting edge, ensuring that you don't just react to what's happening, but you're ready for what's coming.
Recommendation 3: Implement a Multichannel Tracking and Analytics Platform: In a world where customers interact with your business across various platforms, it's vital to have a holistic view of your funnel. Platforms such as Google Analytics 4 allow for cross-platform tracking, giving a unified picture of user behavior. With mobile e-commerce sales expected to comprise 54% of all e-commerce sales by 2021, according to Statista, it's clear that understanding how users move across devices is crucial. By employing a tool that provides granular insight into user paths, you can create a frictionless experience that not only stands up to current trends but sets the stage for future-proof success.
Relevant Links
- Your Ultimate Guide to WeChat: China's Super App Powerhouse
- Conquer China's Short-Video Scene: Strategies for Douyin and Kuaishou Success
- Elevate Your Online Store with SEO Strategies for South Korea
- Wildberries Winning Tactics: Strategies for Success on Russia’s Top Marketplace
- Amplify Your Brand with SEO Strategies for Germany's Diverse Markets
Conclusion
Wrapping up a deep dive into the world of sales funnel efficiency, it's crystal clear that the metrics guiding this process are far from just a series of numbers. They are the unspoken narrative of your customer's journey, the whispers of success, or the calls for change in your strategies. Each stage within the sales funnel, from the wide mouth of awareness down to the narrow spout of action, is a testament to the orchestrated effort of marketing and sales teams working in tandem. How well are they performing? Well, that's where the numbers come to play.
With the aid of performance metrics like Conversion Rate, Customer Acquisition Cost, and Customer Lifetime Value, businesses are gifted with a magnifying glass, able to zoom in on the precise areas that shout for improvement or sing with efficiency. These numbers can sometimes reveal uncomfortable truths about budget drains or time sinks, but they also have the power to unify teams under a common goal—to create a seamless, effective path from 'just looking' to 'take my money!'
Visual tools bring this data to life, transforming them into digestible bar charts or striking funnel visualizations that make it easy to spot the bumps in the road. By regularly checking these metrics, adjusting tactics, and embracing a cycle of continual improvement, the sales funnel becomes less of a mystery and more of a well-oiled machine driving towards business growth.
So, as you step back from the figures and the charts, remember that these metrics are not just numbers; they're the pulse of your marketing efforts and the heartbeat of your sales. Keep them healthy with regular check-ups and never stop asking: how can we do better? Let the metrics guide your steps, and may your sales funnel be ever flowing.

FAQs
Question 1: What is a sales funnel?
Answer: A sales funnel is like a roadmap of a buyer's journey, showing the path from when they first learn about a product to when they make a purchase. It shines a light on how well a company's sales and marketing efforts are working.
Question 2: What are sales funnel metrics?
Answer: Think of sales funnel metrics as the scoreboard for business performance. They are the numbers that tell the tale of customer acquisition and the teamwork between sales and marketing.
Question 3: Why are sales funnel metrics important?
Answer: Sales funnel metrics are like a business's compass. They pinpoint where things might be going off track, offer clues on how to smooth the sales path, and give the insights needed to jazz up the customer's experience.
Question 4: What are the key stages of a sales funnel?
Answer: A typical sales funnel has six stages: awareness, interest, consideration, intent, evaluation, and action. Picture these as the steps a customer climbs from being a newbie to becoming a buyer, usually categorized into top, middle, and bottom stages.
Question 5: How do you calculate customer lifetime value (LTV)?
Answer: To figure out LTV, you take what a customer spends and divide it by how long they stick around. It's like knowing how valuable a customer is over the long haul so you can decide smartly on how much to spend getting new ones.
Question 6: What is the CAC payback period?
Answer: The CAC payback period is all about timing – it's how long it takes for a business to earn back what it spent to get a new customer. If the time is short, it means the business is getting back on its feet quicker after investing in marketing and sales.
Question 7: How do you track and analyze sales funnel metrics?
Answer: You keep your eyes on the numbers by using tools like CRM systems, pixel tracking, and Google Analytics. Constantly check how things are working, spot trends and weak spots, and make improvements.
Question 8: What are the essential metrics to focus on?
Answer: Focus on the critical numbers: how many people are buying, how long it takes to close a deal, how big these deals are, what it costs to grab a new customer, and how much they're worth over time. These tell you the health and wealth of your sales process.
Question 9: How do you align sales and marketing teams using sales funnel metrics?
Answer: By setting clear, common goals based on important metrics, sales and marketing teams can move in the same direction. It's about being on the same page so that everyone knows where to boost their efforts.